Connect to your Datorama / Tableau data directly
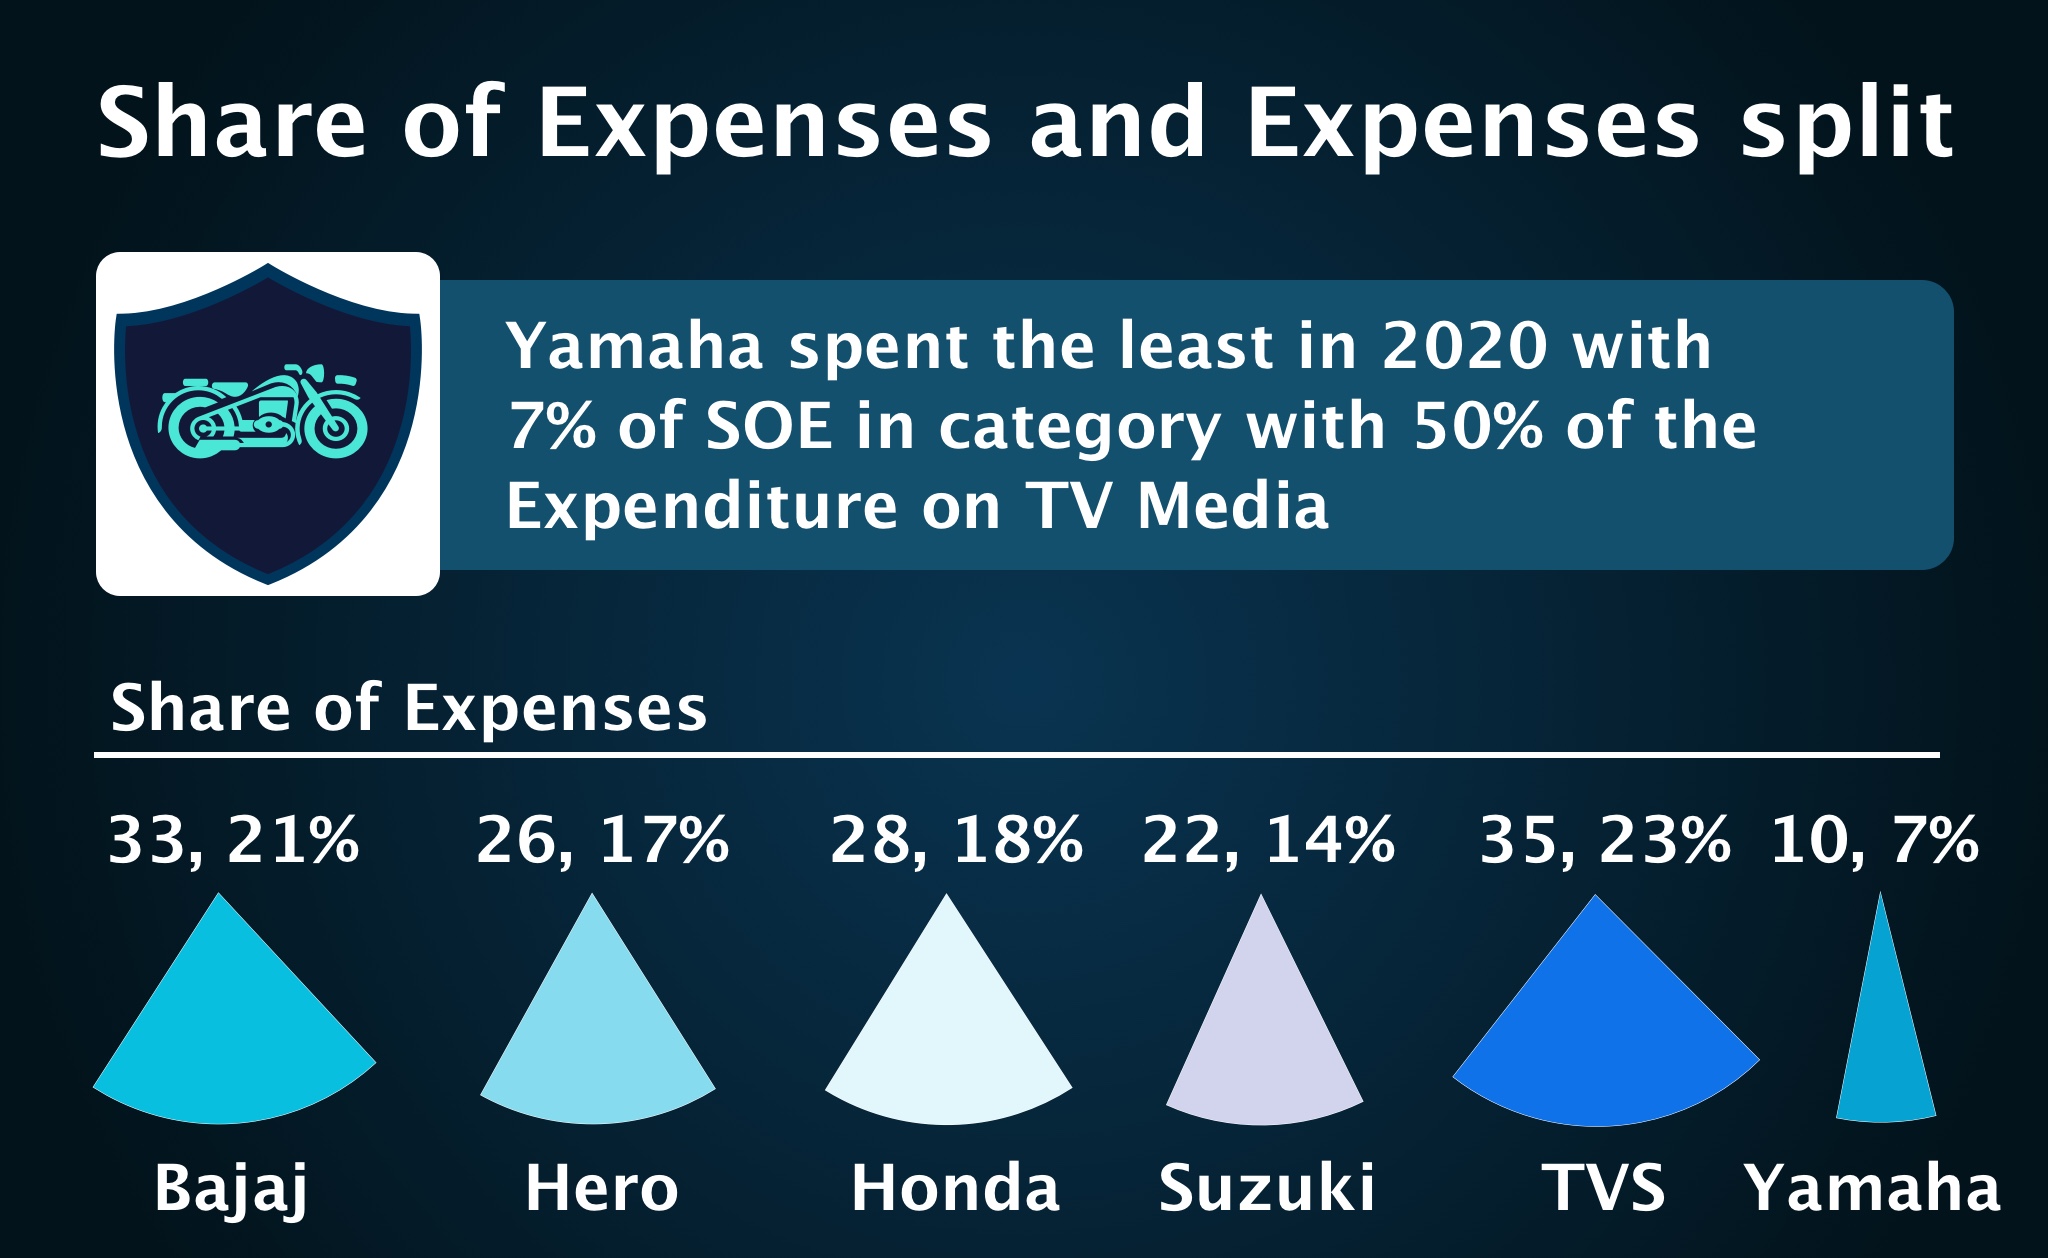
Track Categories against Media Spends and Value generated. This template helps with the analysis.
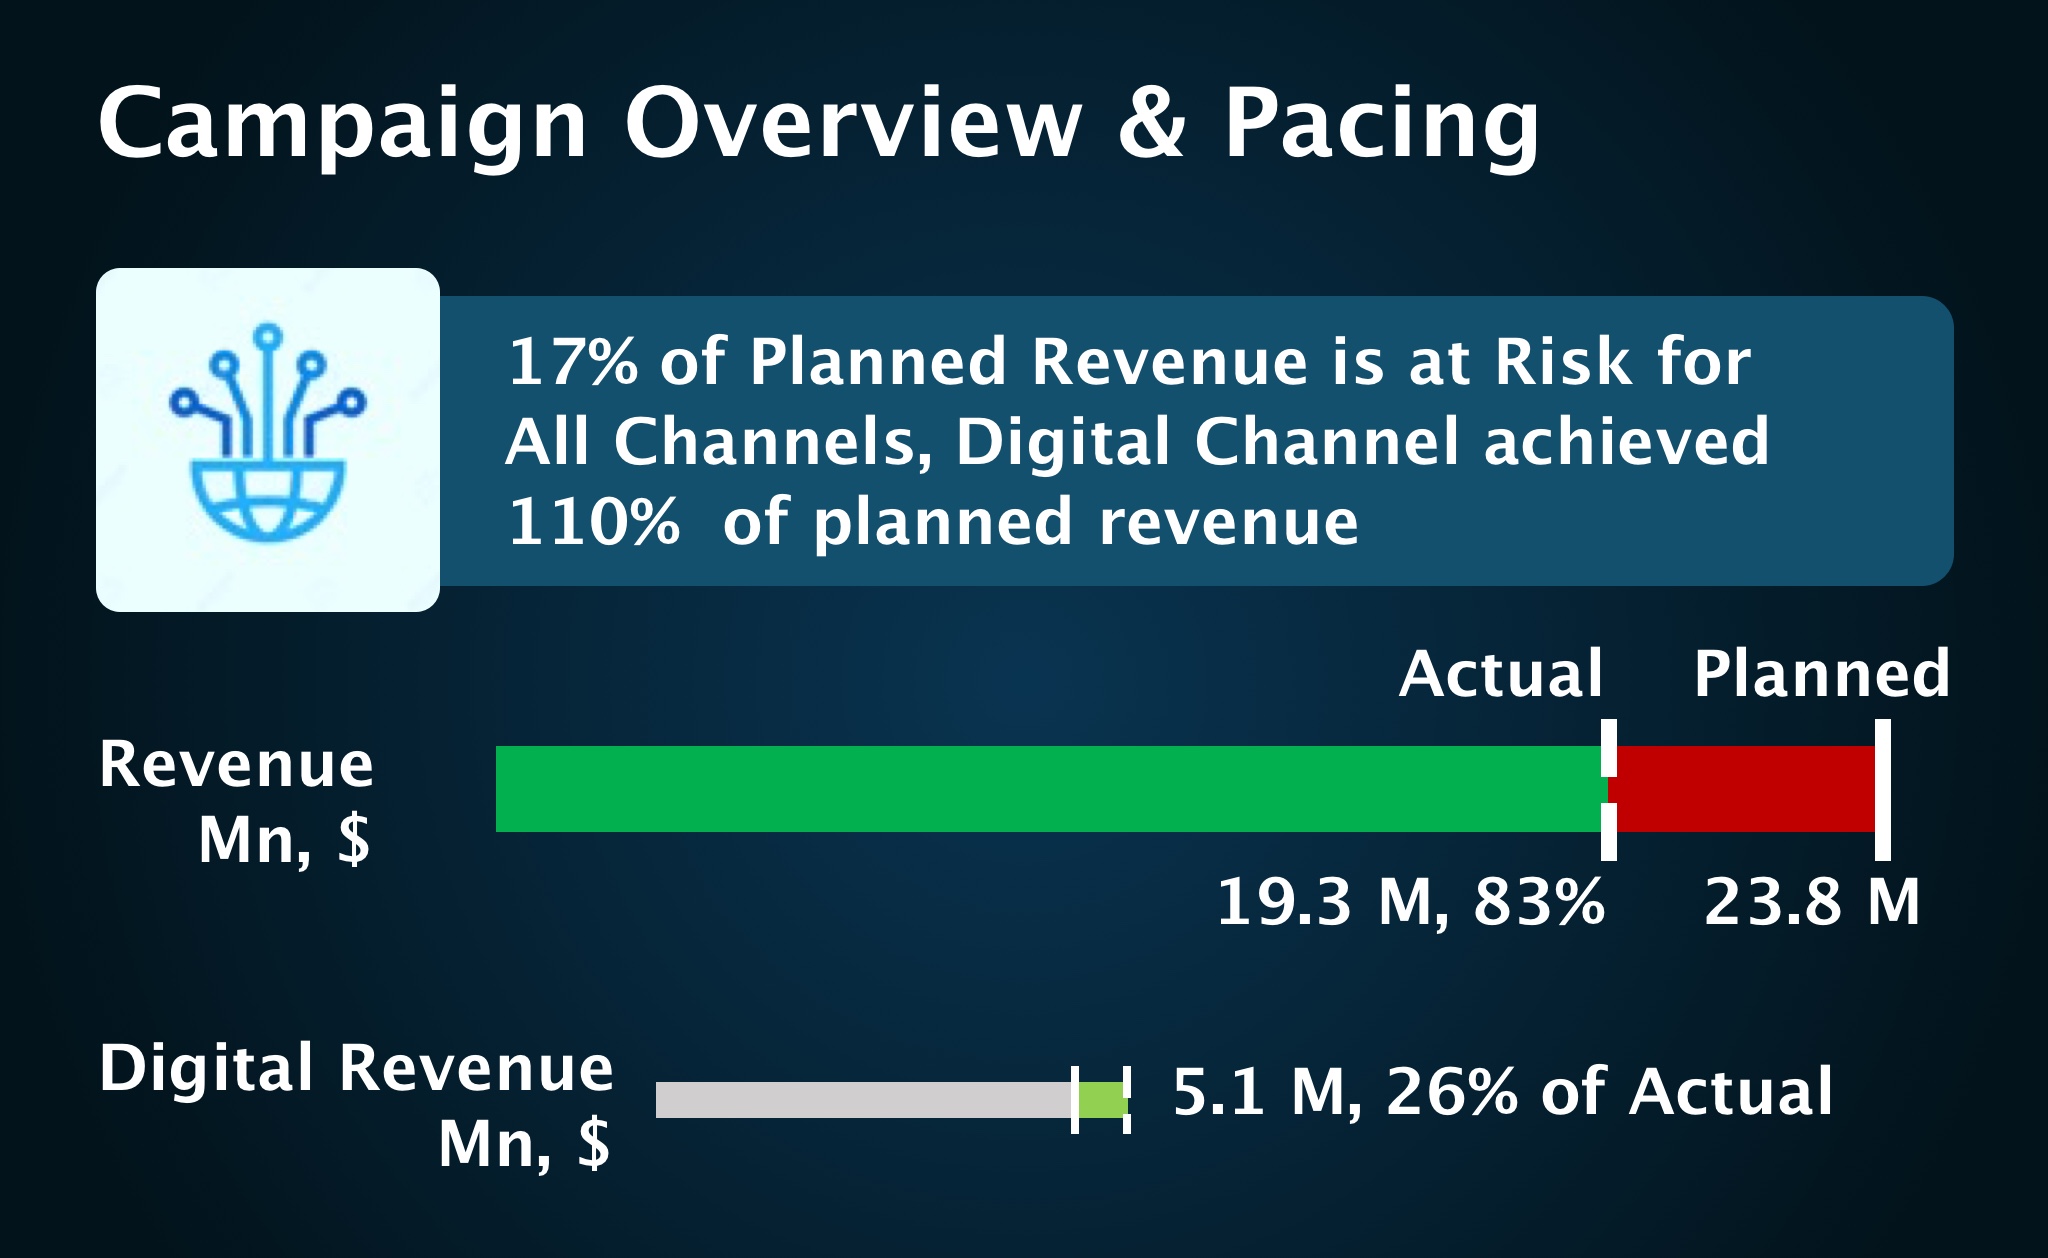
Accurate, up to date pacing is the key to ensuring every campaign’s budget and delivery goals are met every time. This bot helps in tracking of Campaigns related key data.
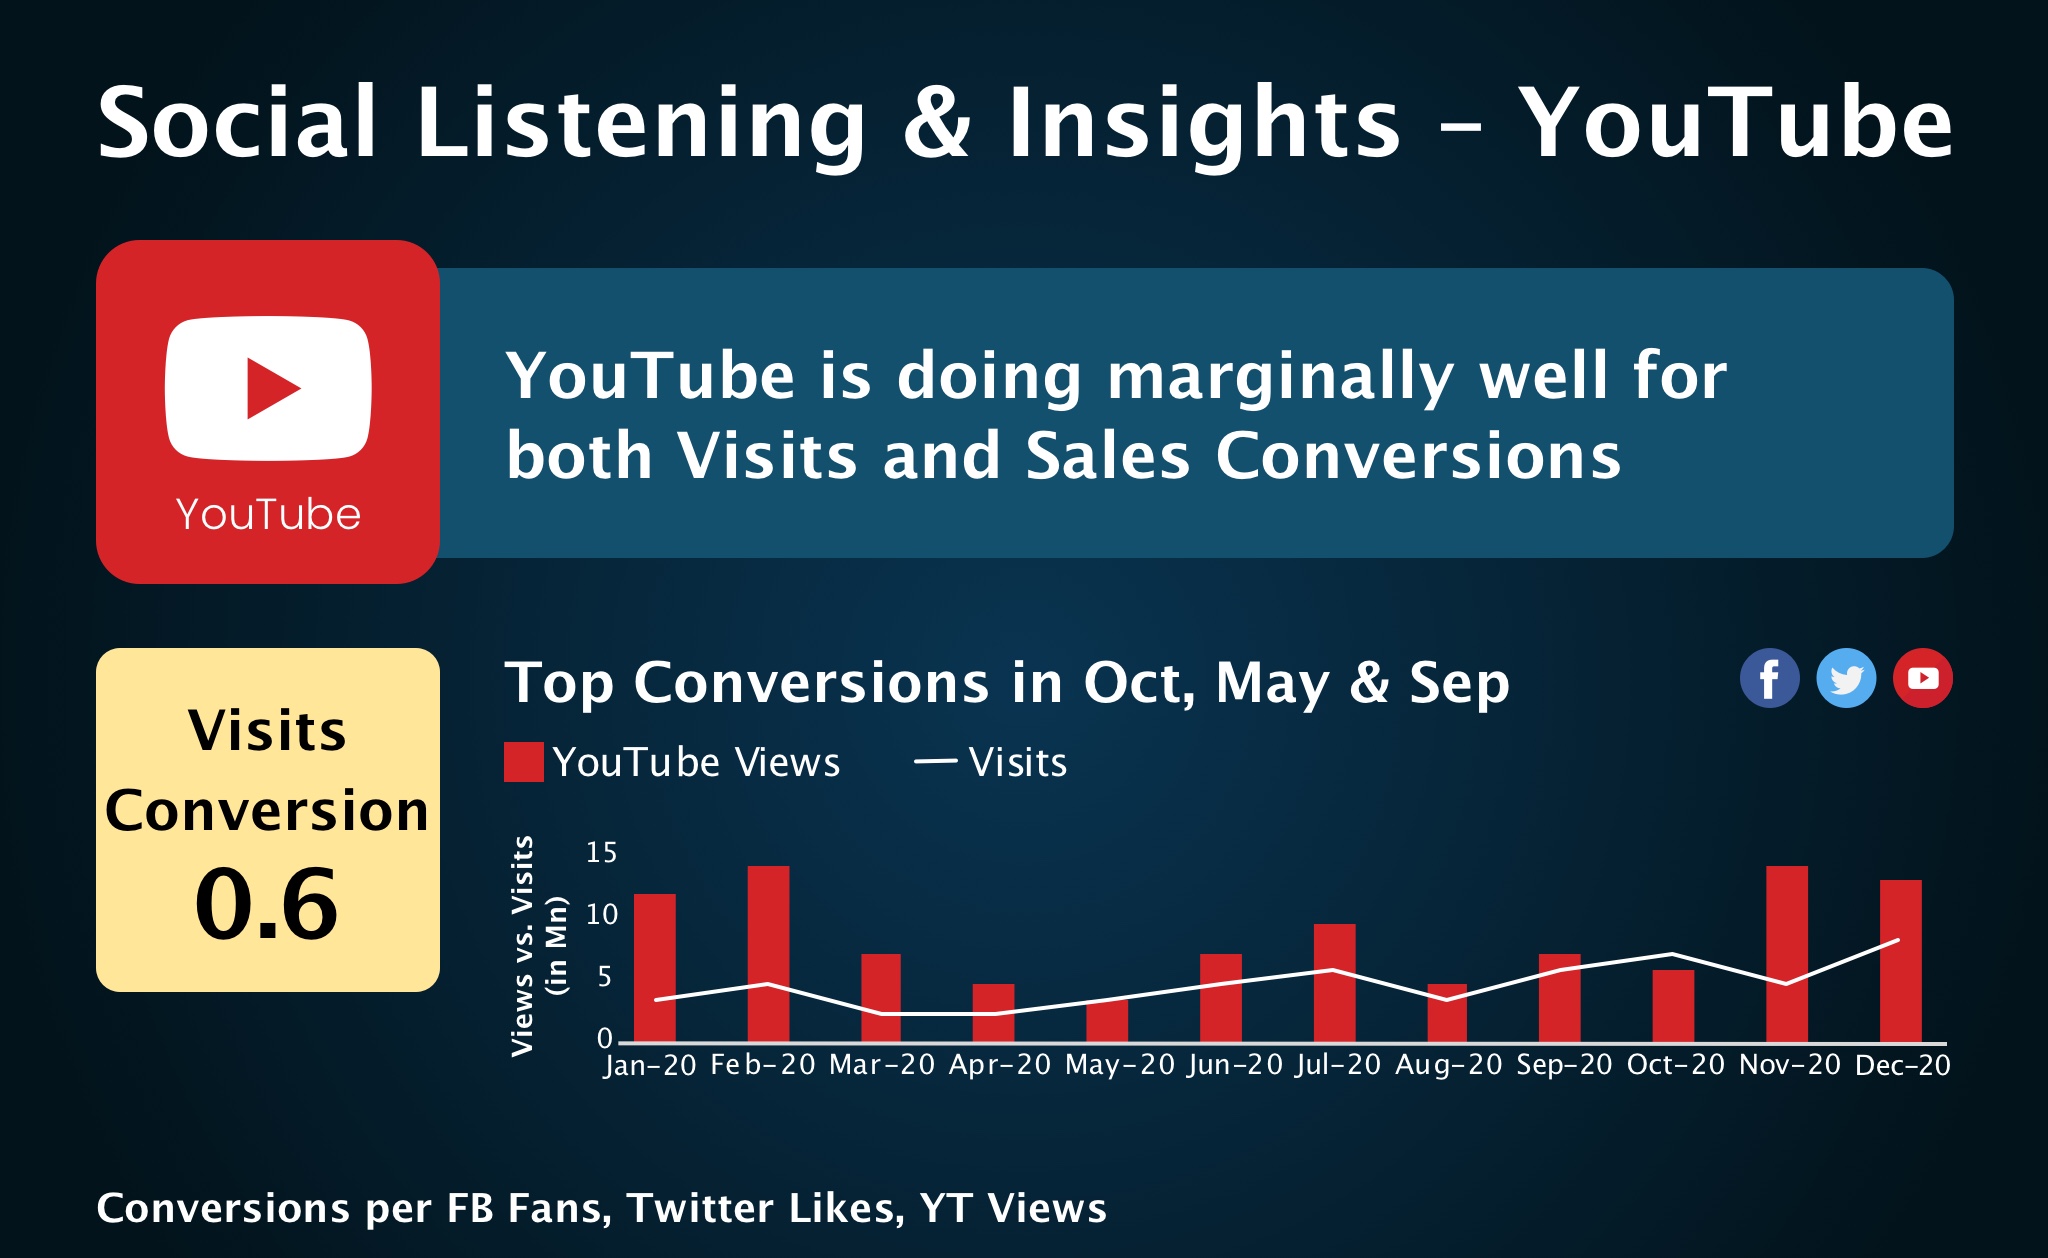
Helping clients understand their audiences brand perceptions, motivations and topics of interest adds valuable context to campaigns. This bot helps in tracking key KPIs against Social data.
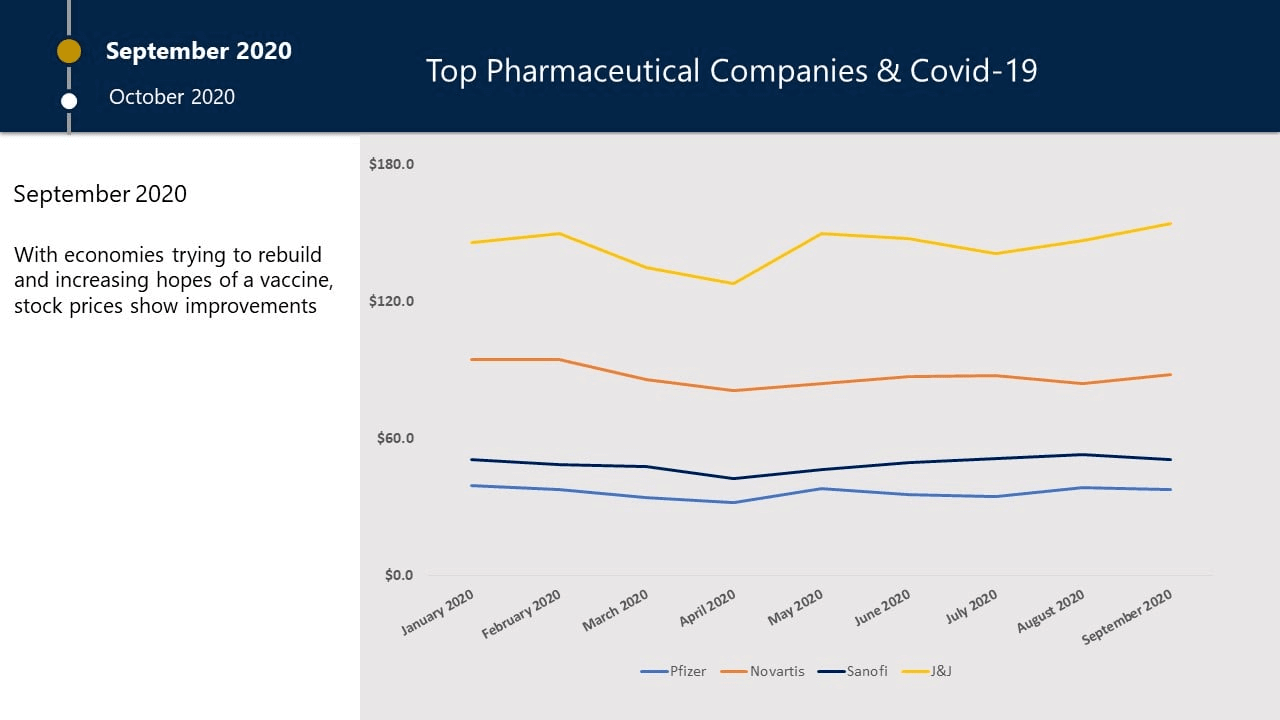
A fund manager wants to track the stock prices of major pharmaceutical companies in the wake of Covid-19 and compare them to see how they react to global events. SlideSense is a good fit to present an animated comparison chart annotated with events that drive the prices.
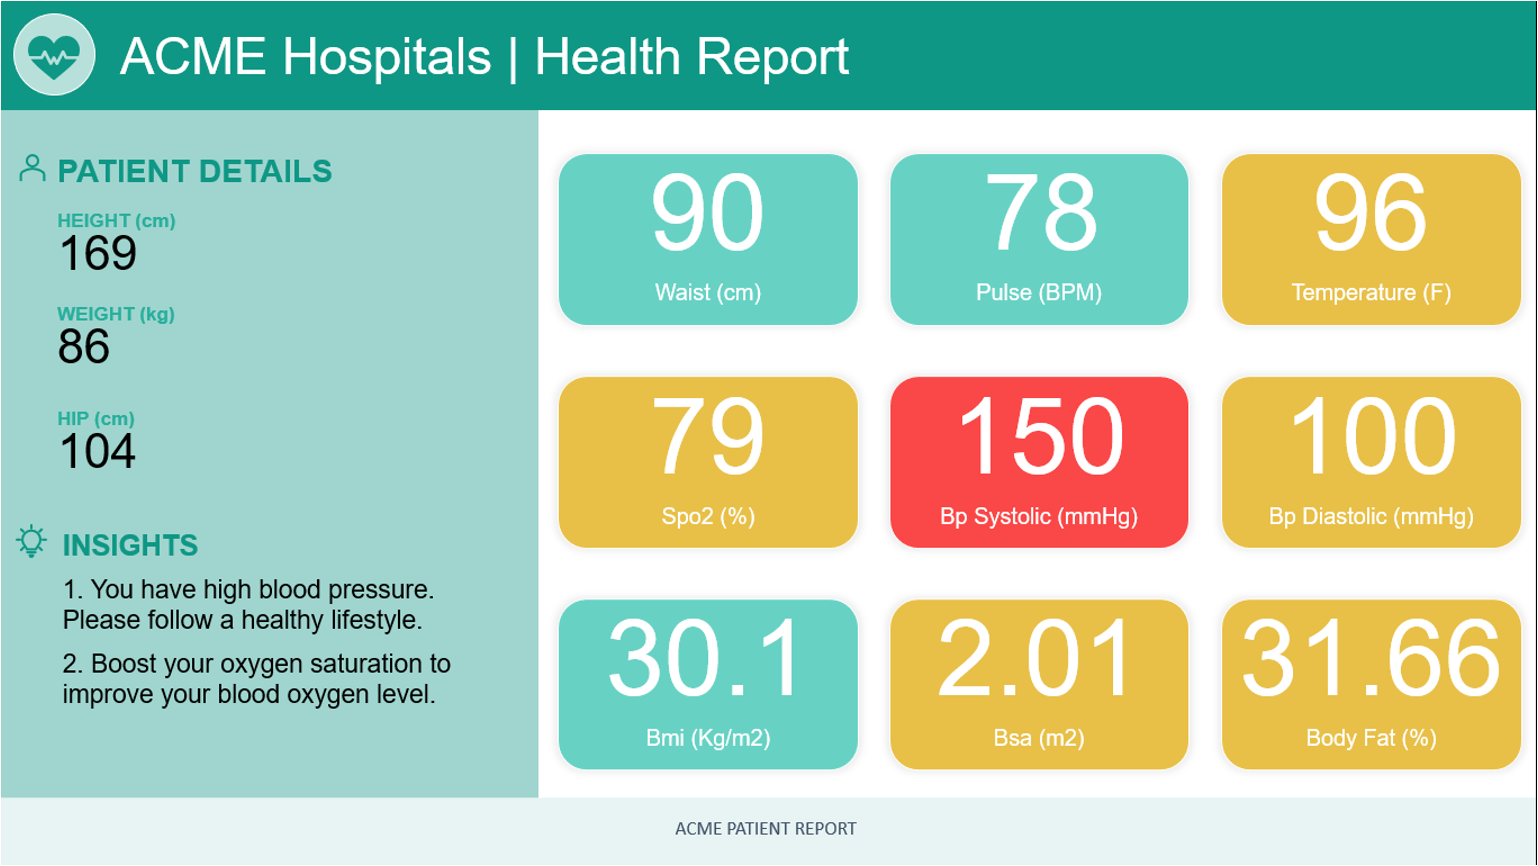
Automated health statistics reports generated for all patients reducing substantial manual effort with increased accuracy
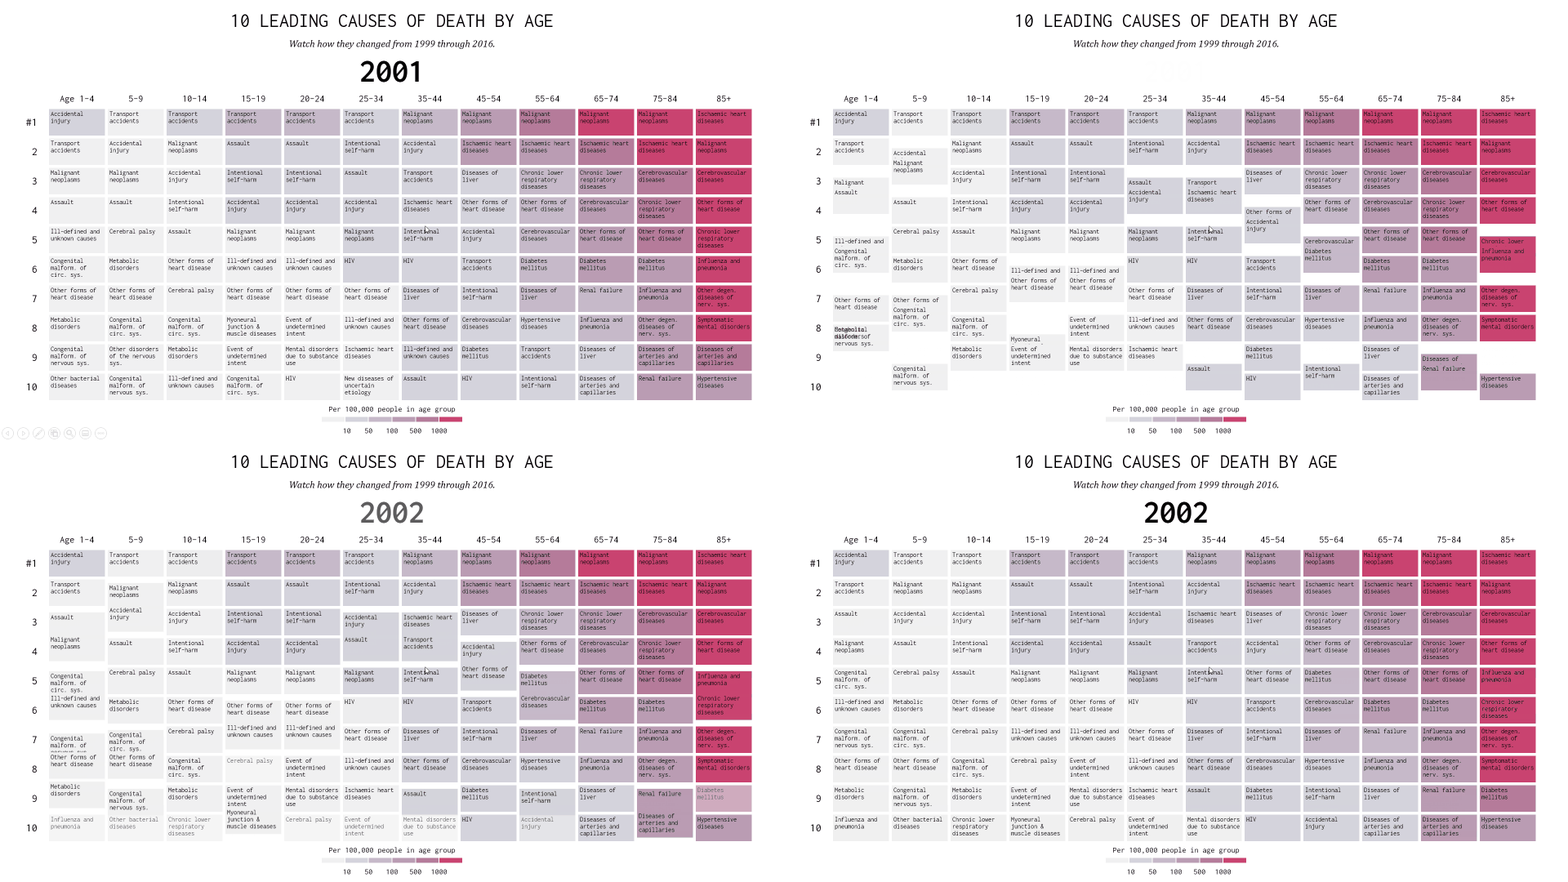
This report shows the top 10 causes of death by age group, across years.
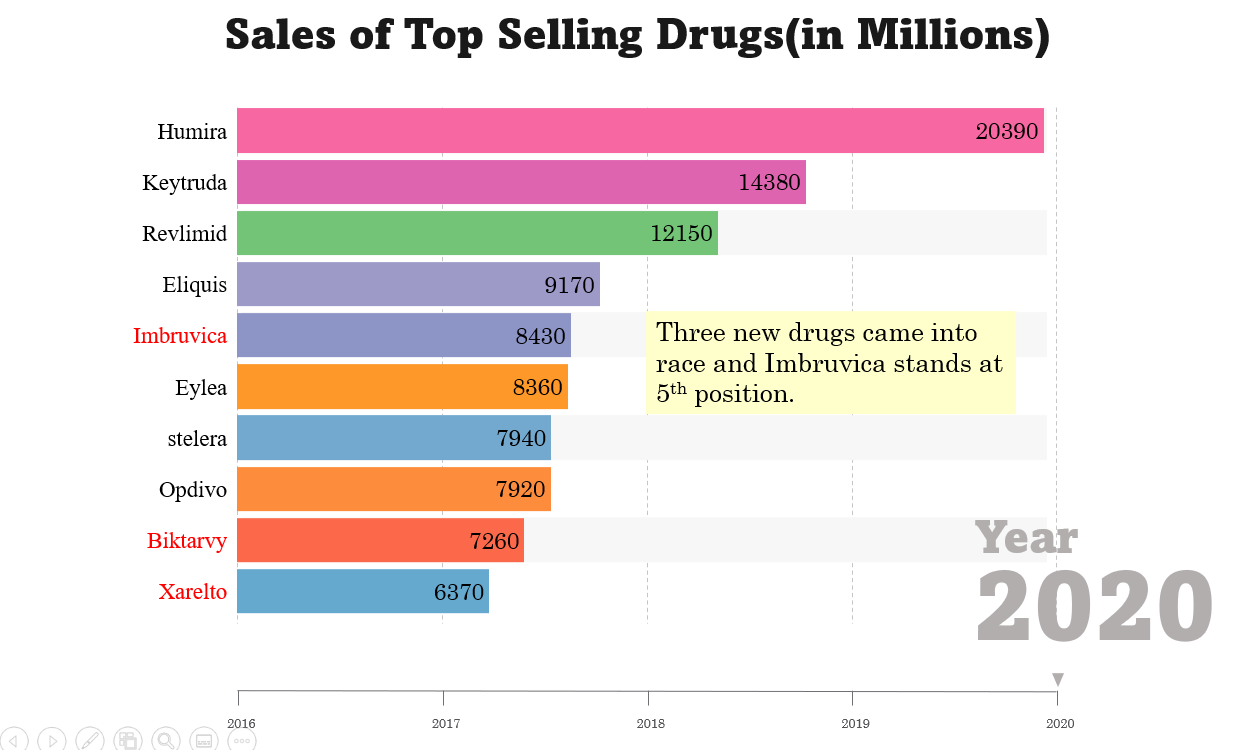
Revlimid has grown from being the 7th bestselling pharmaceutical drug to the 3rd in 1 year. Keytruda has grown from being the 6th bestselling pharmaceutical drug to the 2nd in 1 year. But there's one drug that's been #1 for the last 5 years.
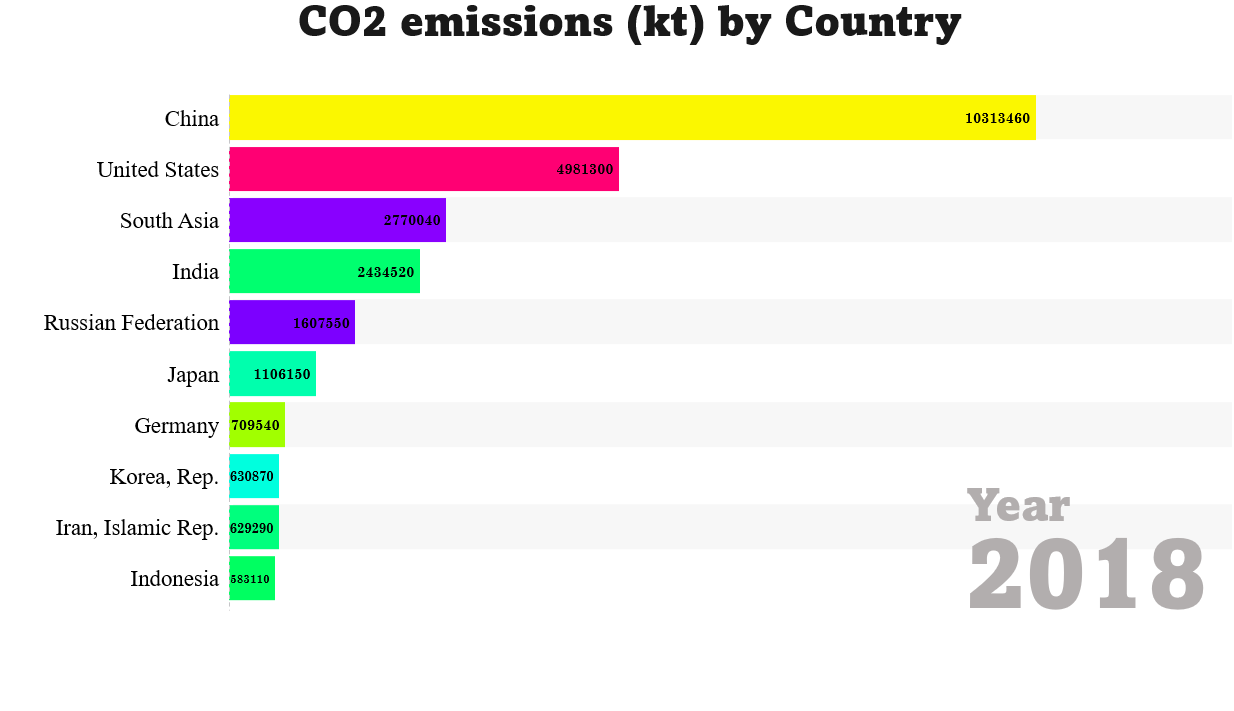
From 1990 to 2004, the United States had the highest CO2 emissions. In 2000 the United States emitted as much as China, Japan & Russia put together, but by 2018 another country has taken the leading spot, emitting as much as the next 3 countries put together.
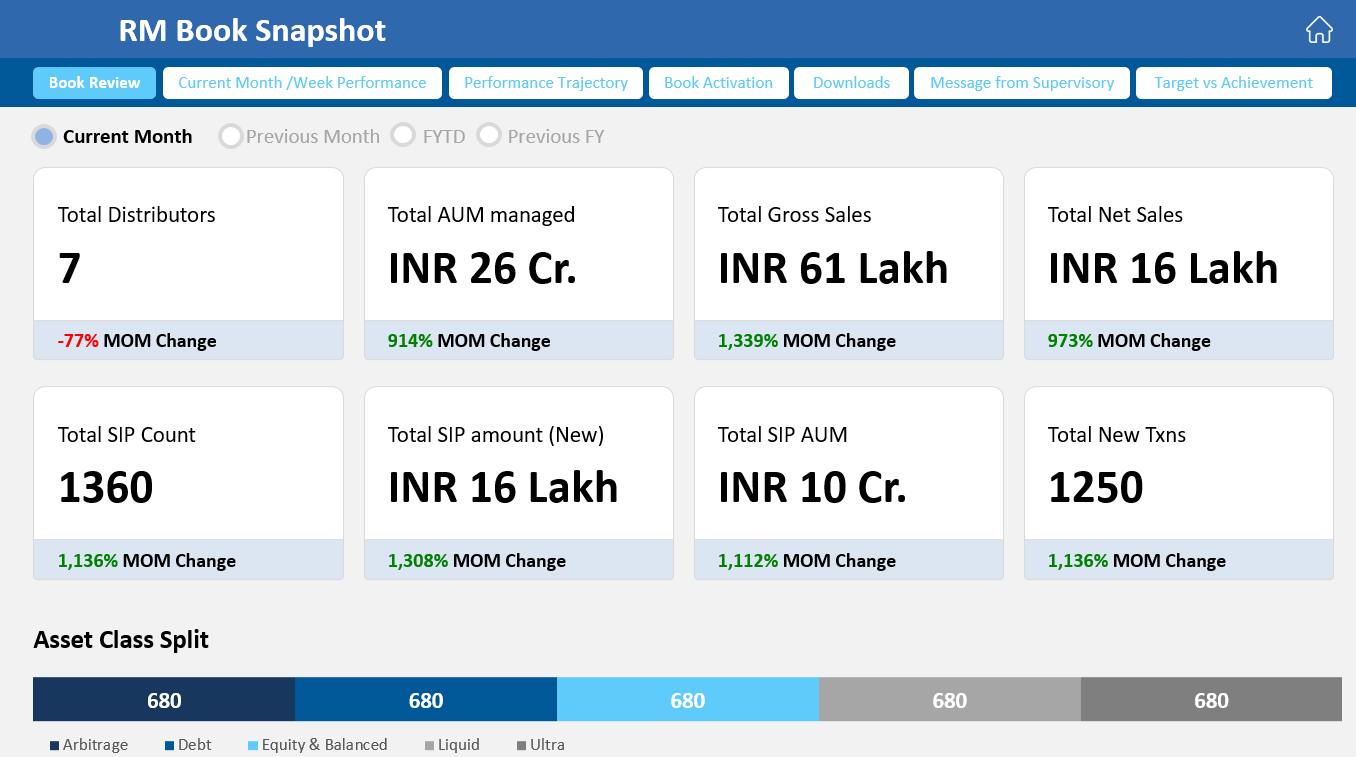
Sales Planner that helps your organization to track performance of your managers, financial advisers and distributors. This templates help you track performance across key indicators to help in quick decision making.
How can we show the global sales break-up at every level for a CPG company? An interactive sunburst of market opportunities across countries to identify areas of focus -- in PowerPoint.
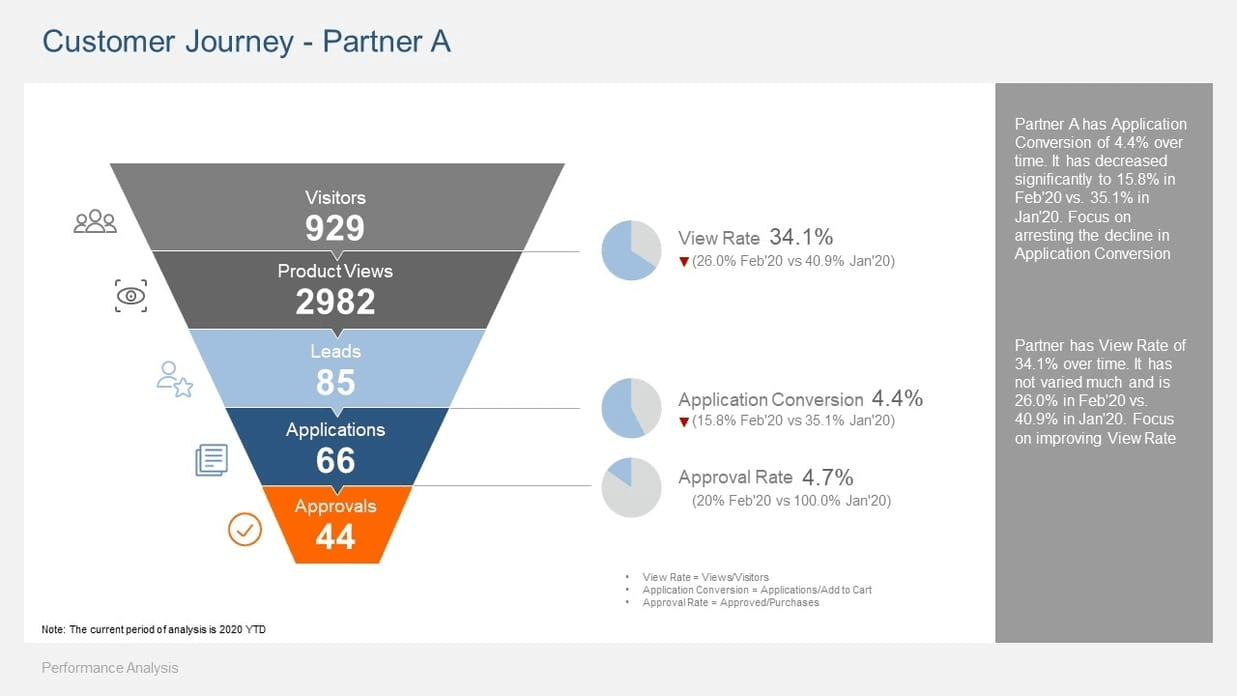
An e-commerce firm wants to track the customer journey to understand the flow of visitors, product views, and conversions. Since it is a recurring review, SlideSense is perfect to generate presentations automatically without having to use BI tools.
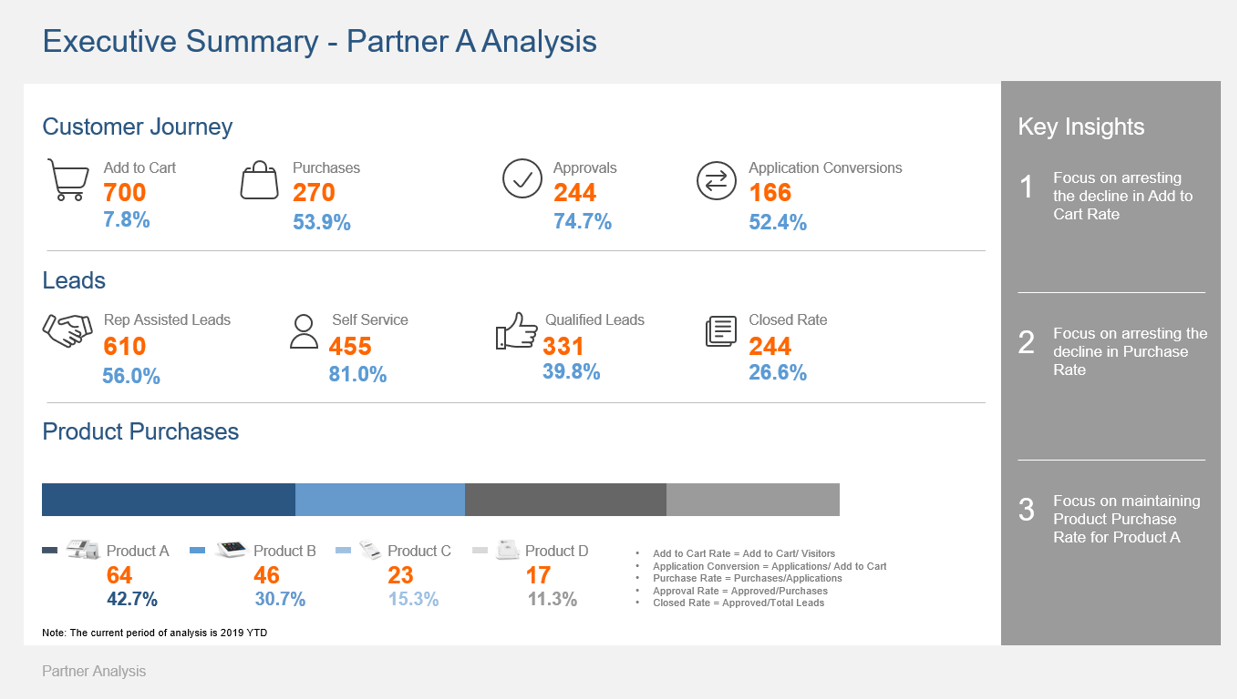
A leading POS payments technology provider partners with 90+ resellers to sell its 4 variants of products. Regular performance checks are critical for a partner. A SlideSense fortnightly report for each partner tracks key customer journey KPIs. Automated Insights identify key phases within customer journey that stand out and help to optimize the customer conversion across phases.
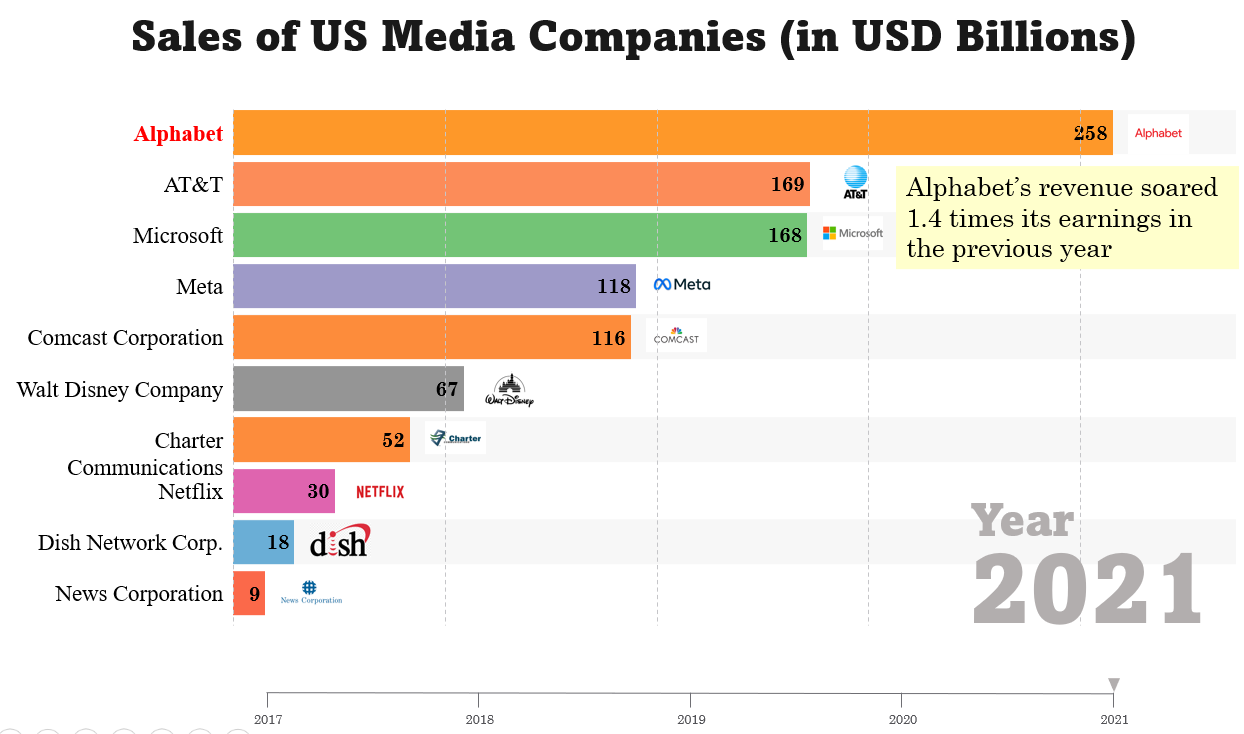
In the last 2 years, once company has beaten Walt Disney, Comcast, and AT&T to become the largest media company in terms of sales.
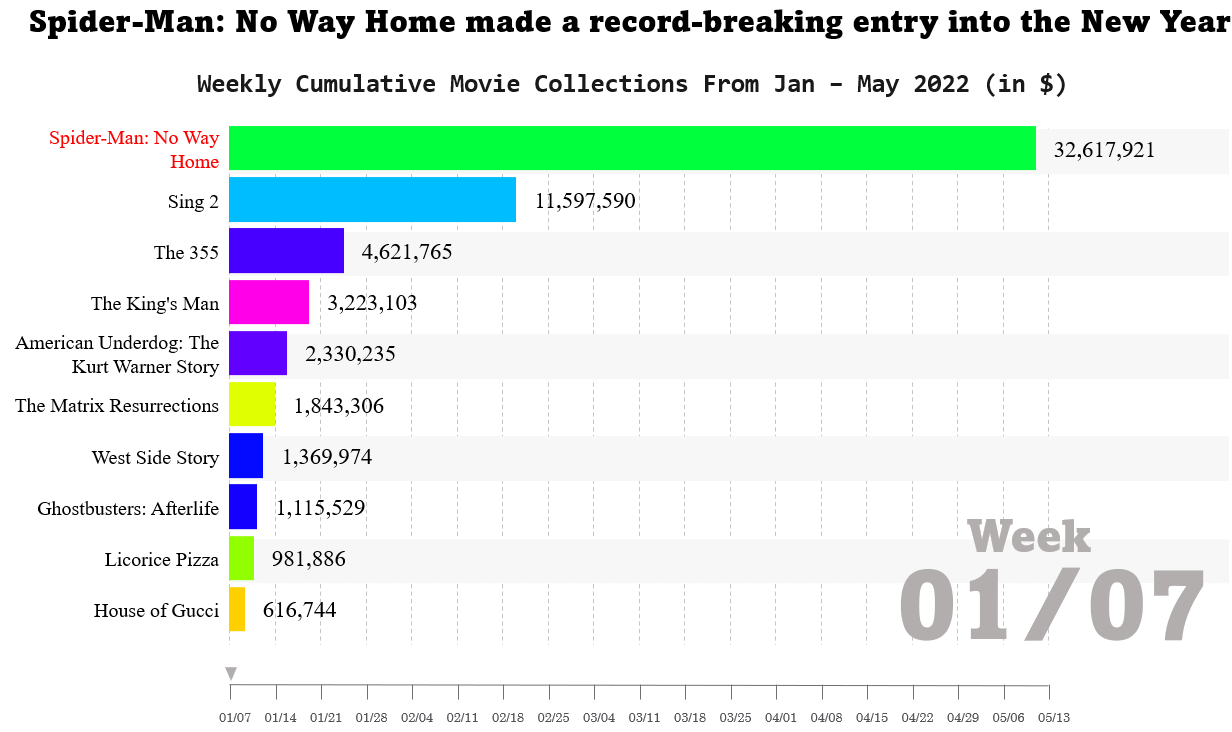
Spider-Man: No Way Home made a record-breaking entry into the New Year, with The Batman ousting Spider-Man in its opening week. But a third super-hero was poised to beat Batman in May 2022.
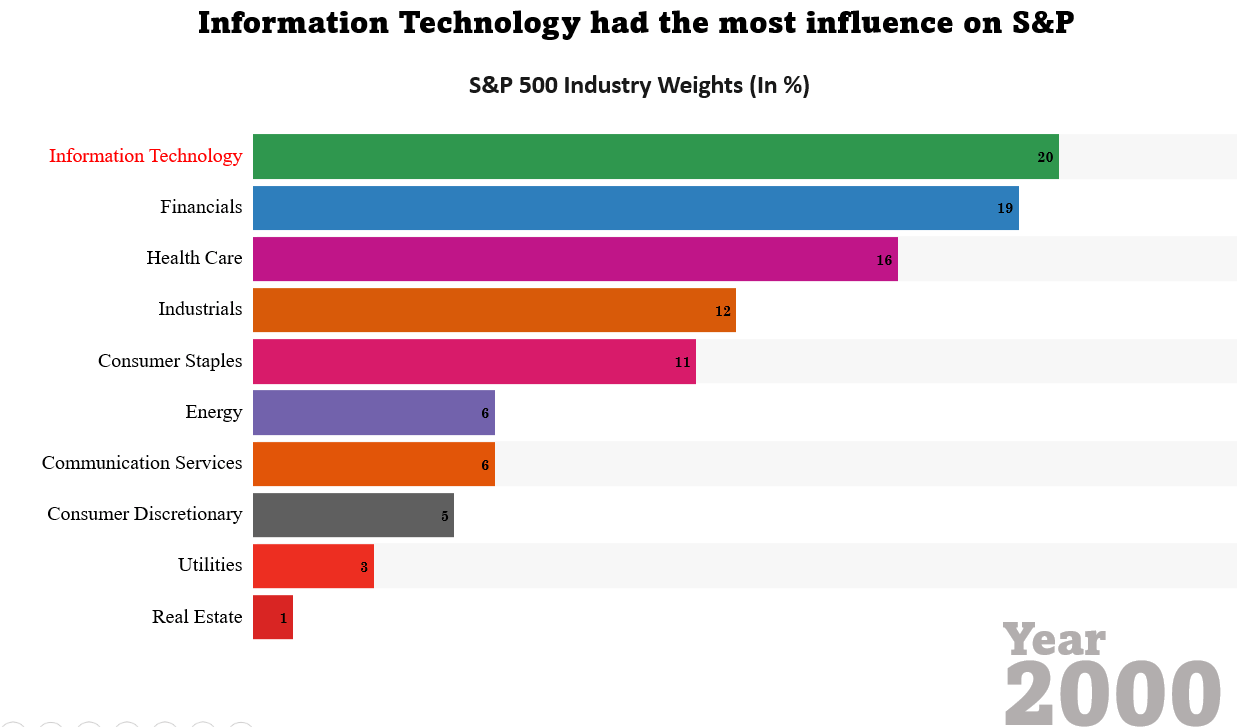
Since 2000, Information Technology and Financials have been #1 and #2 by weightage in the S&P. But one sector, which was ranked at #8 in 2000, has strengthened over the years to become #2 for the first time.
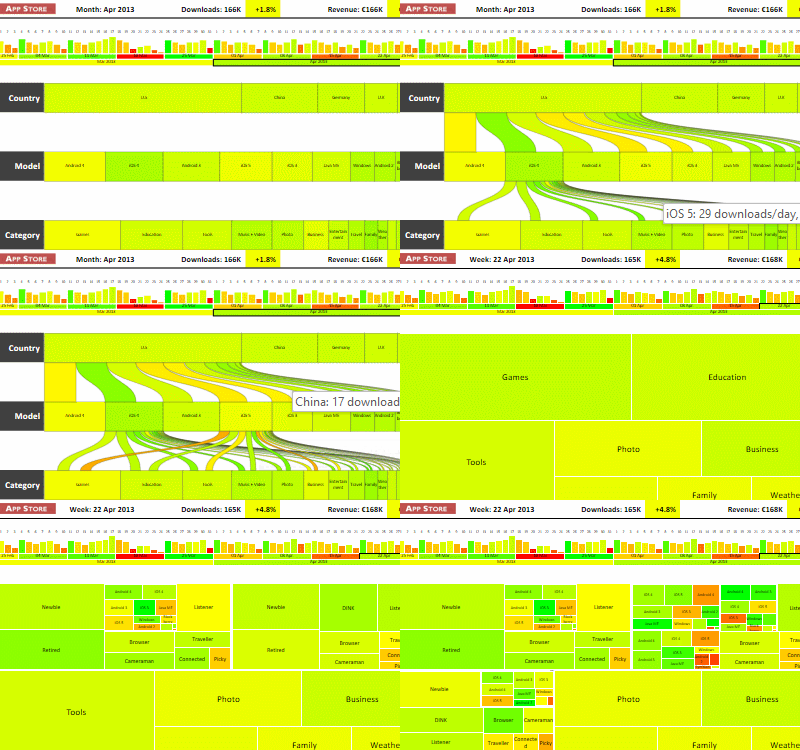
What are the drivers of sales for this mobile application store? This interactive PowerPoint presentation auto-generated from data lets you drill into slides just like a web application - without an Internet connection
A consulting firm wants to compare a set of companies by industry. Given a set of company tickers, SlideSense charts and animations can be effectively used to compare the revenue, YoY growth, margins, and other key financial metrics- with insights and news.
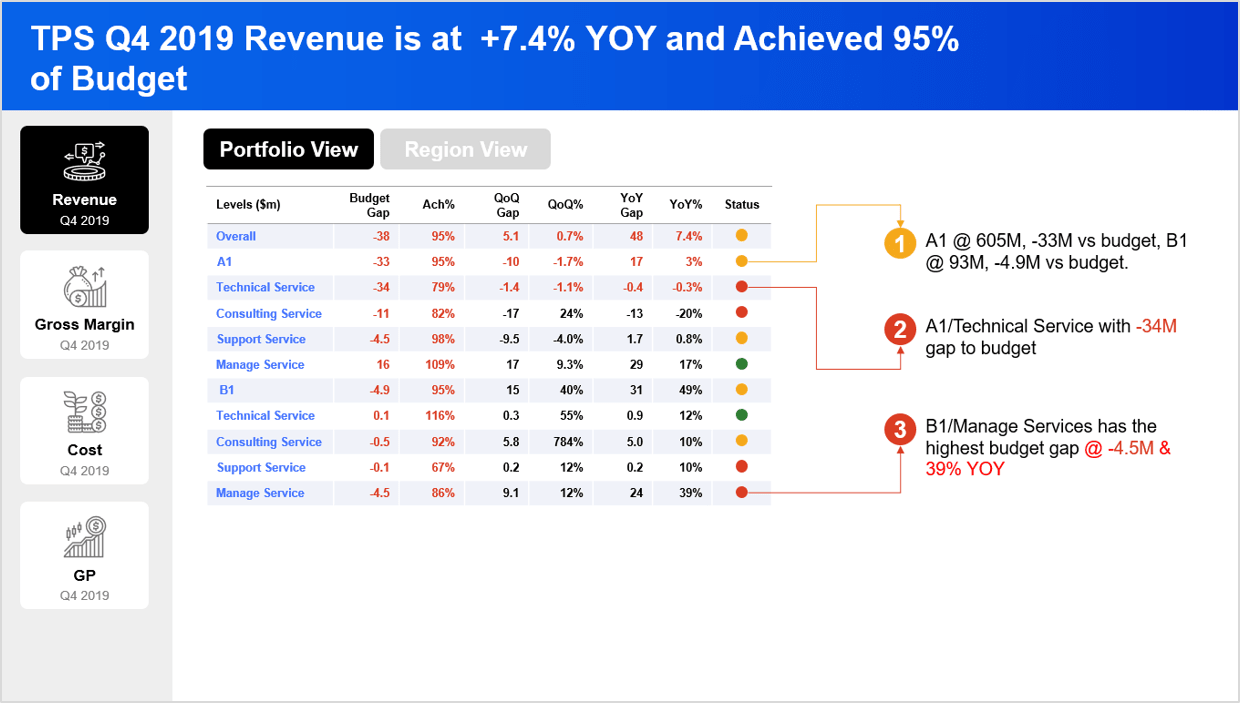
A leading technology provider with a global presence tracks its financials across six regions and 30 countries with an objective of maximizing profits. A SlideSense monthly report with a drill down approach enables the company to view data at a desired level of granularity. Automated insights generated by SlideSense help in quick identification of both top and bottom performers.